Note
Go to the end to download the full example code.
6061T6 aluminum uncertainty quantification validation
In this example, we will use MatCal’s ParameterStudy
to validate the estimated parameter uncertainty for the calibration.
We do this by generating samples from the fitted covariance from
6061T6 aluminum calibration with anisotropic yield and
running the calibrated models with these samples. Then the
model results are compared to the data to see how well the sampled parameter
sets allow the models to represent the data uncertainty.
Note
Useful Documentation links:
To begin, we import the tools we need for this study and setup the data and model as we did in 6061T6 aluminum calibration with anisotropic yield.
from matcal import *
from site_matcal.sandia.computing_platforms import is_sandia_cluster, get_sandia_computing_platform
from site_matcal.sandia.tests.utilities import MATCAL_WCID

import numpy as np
import matplotlib.pyplot as plt

plt.rc('text', usetex=True)
plt.rc('font', family='serif')
plt.rc('font', size=12)
figsize = (4,3)

tension_data_collection = BatchDataImporter("aluminum_6061_data/"
                                              "uniaxial_tension/processed_data/"
                                              "cleaned_[CANM]*.csv",).batch

down_selected_tension_data = DataCollection("down selected data")
for state in tension_data_collection.keys():
    for index, data in enumerate(tension_data_collection[state]):
        stresses = data["engineering_stress"]
        strains = data["engineering_strain"]
        peak_index = np.argmax(stresses)
        peak_strain = strains[peak_index]
        peak_stress = stresses[peak_index]
        data_to_keep = (((strains>peak_strain) & (stresses > 0.89*peak_stress)) |
                        (strains>0.005) & (strains < peak_strain))
        down_selected_tension_data.add(data[data_to_keep])

down_selected_tension_data = scale_data_collection(down_selected_tension_data,
                                                   "engineering_stress", 1000)
down_selected_tension_data.remove_field("time")

material_filename = "hill_plasticity_temperature_dependent.inc"
material_model = "hill_plasticity"
material_name = "ductile_failure_6061T6"
sierra_material = Material(material_name, material_filename, material_model)

gauge_radius = 0.125
element_size = gauge_radius/8
geo_params = {"extensometer_length": 1.0,
              "gauge_length": 1.25,
              "gauge_radius": gauge_radius,
              "grip_radius": 0.25,
              "total_length": 4,
              "fillet_radius": 0.188,
              "taper": 0.0015,
              "necking_region":0.375,
              "element_size": element_size,
              "mesh_method":3,
              "grip_contact_length":1}

tension_model = RoundUniaxialTensionModel(sierra_material, **geo_params)
tension_model.set_name("tension_model")
tension_model.add_boundary_condition_data(down_selected_tension_data)
tension_model.set_allowable_load_drop_factor(0.70)
tension_model.set_boundary_condition_scale_factor(1.5)

if is_sandia_cluster():
  tension_model.run_in_queue(MATCAL_WCID, 1)
  tension_model.continue_when_simulation_fails()
  platform = get_sandia_computing_platform()
  num_cores = platform.get_processors_per_node()
else:
  num_cores = 8
tension_model.set_number_of_cores(num_cores)

top_hat_data_collection = BatchDataImporter("aluminum_6061_data/"
                                              "top_hat_shear/processed_data/cleaned_*.csv").batch
for state, state_data_list in top_hat_data_collection.items():
    for index, data in enumerate(state_data_list):
        max_load_arg = np.argmax(data["load"])
        data = data[data["time"] < data["time"][max_load_arg]]
        data = data[data["load"] > 0.005]
        top_hat_data_collection[state][index] = data[data["displacement"] < 0.02]
top_hat_data_collection.remove_field("time")

top_hat_geo_params = {"total_height":1.25,
        "base_height":0.75,
        "trapezoid_angle": 10.0,
        "top_width": 0.417*2,
        "base_width": 1.625,
        "base_bottom_height": (0.75-0.425),
        "thickness":0.375,
        "external_radius": 0.05,
        "internal_radius": 0.05,
        "hole_height": 0.3,
        "lower_radius_center_width":0.390*2,
        "localization_region_scale":0.0,
        "element_size":0.005,
        "numsplits":1}

top_hat_model = TopHatShearModel(sierra_material, **top_hat_geo_params)
top_hat_model.set_name('top_hat_shear')
top_hat_model.set_allowable_load_drop_factor(0.05)
top_hat_model.add_boundary_condition_data(top_hat_data_collection)
top_hat_model.set_number_of_cores(num_cores*2)
if is_sandia_cluster():
  top_hat_model.run_in_queue(MATCAL_WCID, 1)
  top_hat_model.continue_when_simulation_fails()

tension_objective = CurveBasedInterpolatedObjective("engineering_strain", "engineering_stress")
tension_objective.set_name("engineering_stress_strain_obj")
top_hat_objective = CurveBasedInterpolatedObjective("displacement", "load")
top_hat_objective.set_name("load_displacement_obj")

RT_calibrated_params = matcal_load("anisotropy_parameters.serialized")
yield_stress = Parameter("yield_stress", 15, 50,
        RT_calibrated_params.pop("yield_stress"))
hardening = Parameter("hardening", 0, 60,
        RT_calibrated_params.pop("hardening"))
b = Parameter("b", 10, 40,
        RT_calibrated_params.pop("b"))
R22 = Parameter("R22", 0.8, 1.15,
        RT_calibrated_params["R22"])
R33 = Parameter("R33", 0.8, 1.15,
        RT_calibrated_params["R33"])
R12 = Parameter("R12", 0.8, 1.15,
        RT_calibrated_params["R12"])
R23 = Parameter("R23", 0.8, 1.15,
        RT_calibrated_params["R23"])
R31 = Parameter("R31", 0.8, 1.15,
        RT_calibrated_params["R31"])

pc = ParameterCollection("uncertain_params", yield_stress, hardening, b)

high_temp_calibrated_params = matcal_load("temperature_dependent_parameters.serialized")
tension_model.add_constants(**high_temp_calibrated_params,
                            **RT_calibrated_params)
top_hat_model.add_constants(**high_temp_calibrated_params,
                            **RT_calibrated_params)

results = matcal_load("laplace_study_results.joblib")
After importing laplace study results, we can
sample parameters sets from the estimated parameter
uncertainties using sample_multivariate_normal().
num_samples = 50
uncertain_parameter_sets = sample_multivariate_normal(num_samples,
                                                      results.mean.to_list(),
                                                      results.fitted_parameter_covariance,
                                                      seed=1234,
                                                      param_names=pc.get_item_names())
/gpfs/knkarls/projects/matcal-stable/external_matcal/matcal/core/parameter_studies.py:919: RuntimeWarning: covariance is not symmetric positive-semidefinite.
  samples = rng.multivariate_normal(mean, sigma, nsamples).T
Now we set up a study so we can
visualize the results by pushing the samples back through the models.
We do so using a MatCal ParameterStudy.
param_study = ParameterStudy(pc)
param_study.add_evaluation_set(tension_model, tension_objective, down_selected_tension_data)
param_study.add_evaluation_set(top_hat_model, top_hat_objective, top_hat_data_collection)
param_study.set_core_limit(250)
param_study.set_working_directory("UQ_sampling_study", remove_existing=True)
params_to_evaluate = zip(uncertain_parameter_sets["yield_stress"],
                         uncertain_parameter_sets["hardening"],
                         uncertain_parameter_sets["b"])
Next, we add parameter evaluations for each of the samples.
We do so by organizing the data using Python’s
zip function and then loop over the result
to add each parameter set sample to the study.
Warning
We add error catching to the addition of each parameter evaluation. There is a chance that parameters could be generated outside of our original bounds and we want the study to complete. If this error is caught, we will see it in the MatCal output and know changes are needed. However, some results will still be output and can be of use.
valid_runs = 0
for params in params_to_evaluate:
    y_eval    = params[0]
    A_eval    = params[1]
    b_eval    = params[2]

    try:
      param_study.add_parameter_evaluation(yield_stress=y_eval, hardening=A_eval,b=b_eval)
      print(f"Running evaluation {params}")
      valid_runs +=1
    except ValueError:
       print(f"Skipping evaluation with {params}. Parameters out of range. ")
Skipping evaluation with (61.64202992956656, 8.820403820213212, -57.71647171700347). Parameters out of range.
Running evaluation (44.1321519596135, 11.389462014361424, 19.68326819492298)
Skipping evaluation with (60.811678877883026, 6.748047202094249, -52.00979933449834). Parameters out of range.
Running evaluation (39.298824203331726, 13.466423383094437, 27.288520869839335)
Skipping evaluation with (53.407906161067004, 8.701519925871798, -25.11025160297849). Parameters out of range.
Skipping evaluation with (68.73508060351831, 7.554226721149954, -81.7724233523923). Parameters out of range.
Running evaluation (36.206480975163345, 14.230059944796583, 34.70195533092863)
Skipping evaluation with (36.420625785679924, 10.53747748382464, 46.43342100522773). Parameters out of range.
Skipping evaluation with (36.274353547447674, 12.194217358063414, 43.020784187904155). Parameters out of range.
Running evaluation (42.04079235171928, 12.478665037058063, 12.602130503968048)
Skipping evaluation with (28.920575501564883, 13.329312809871965, 70.73128227285274). Parameters out of range.
Skipping evaluation with (69.59956263479413, 8.36089404754379, -97.10625193145192). Parameters out of range.
Skipping evaluation with (55.91588082262706, 11.739100541417915, -44.32646791164149). Parameters out of range.
Skipping evaluation with (43.083673191449684, 13.459286764575976, 0.677586331267193). Parameters out of range.
Skipping evaluation with (48.032432271333285, 8.633523977033503, -0.31458421474919085). Parameters out of range.
Skipping evaluation with (24.448520809569693, 14.606140103358797, 81.62300501307931). Parameters out of range.
Running evaluation (39.95147774276401, 9.99819413261834, 35.49716217232876)
Skipping evaluation with (35.75673165345737, 13.22777871505103, 40.632644787883386). Parameters out of range.
Skipping evaluation with (25.961313980180577, 12.620705459256978, 85.60171085561089). Parameters out of range.
Skipping evaluation with (11.051337656117745, 18.543713057749944, 134.4925063783011). Parameters out of range.
Running evaluation (37.871754385403385, 12.644189325148723, 34.16074176502345)
Skipping evaluation with (46.359545095708064, 9.612597730684623, 5.558162107430143). Parameters out of range.
Skipping evaluation with (57.85729130869147, 9.251977140452384, -38.64727797893396). Parameters out of range.
Skipping evaluation with (47.63431561832262, 8.439087314748601, 7.197076758806417). Parameters out of range.
Skipping evaluation with (27.862387617781735, 12.911795120750512, 81.02538367639127). Parameters out of range.
Skipping evaluation with (31.774864910982366, 14.64344625675167, 53.01650635370366). Parameters out of range.
Skipping evaluation with (58.43416787989878, 12.002934411684944, -57.108148666904015). Parameters out of range.
Skipping evaluation with (46.75074264245733, 9.650991915386046, 6.343523410539128). Parameters out of range.
Skipping evaluation with (57.0807345826826, 5.829392968711009, -19.99036968650648). Parameters out of range.
Running evaluation (42.16662301438605, 12.384082340721704, 20.022452078578695)
Skipping evaluation with (49.66642962226787, 8.66124484280135, -0.938375852397419). Parameters out of range.
Skipping evaluation with (59.7061757227675, 8.328114713912528, -45.03015787298274). Parameters out of range.
Running evaluation (39.38572497926737, 11.395769927376973, 36.85324771536459)
Skipping evaluation with (52.5258243302152, 6.97644239425619, -8.047507697169664). Parameters out of range.
Skipping evaluation with (32.068389777994305, 16.007988791722937, 48.21224574561377). Parameters out of range.
Skipping evaluation with (34.76578970465711, 14.039853791992712, 43.756172072472424). Parameters out of range.
Running evaluation (39.674592468203414, 11.032053846604134, 35.02417824660738)
Skipping evaluation with (49.12978732739238, 9.87059656249545, -11.971209137508023). Parameters out of range.
Running evaluation (42.786517958344355, 12.80659701183581, 13.16440502544331)
Skipping evaluation with (28.924734840583504, 12.240450666840609, 71.30689910207165). Parameters out of range.
Running evaluation (36.093995353138624, 14.46078780025743, 34.702567857224)
Running evaluation (39.541953494935996, 13.179345538147047, 18.7082201210162)
Skipping evaluation with (37.467135650394965, 9.507344804174878, 50.0760855864975). Parameters out of range.
Running evaluation (38.89504691654207, 12.942052333361614, 26.36547561974567)
Skipping evaluation with (62.24843582607608, 8.475249503837356, -60.7662335616826). Parameters out of range.
Skipping evaluation with (46.93824647301174, 10.688946021434752, -1.0762149670402668). Parameters out of range.
Skipping evaluation with (28.579636767923077, 14.154629425948674, 70.90548707851424). Parameters out of range.
Skipping evaluation with (33.23063447404364, 13.086761487754906, 54.559609365143174). Parameters out of range.
Skipping evaluation with (64.01437454759468, 9.34952320650384, -67.4716374650556). Parameters out of range.
Running evaluation (40.87395654885983, 10.677586170801012, 29.988987054655645)
Next, we launch the study and plot the results. We use functions to simplify the plotting processes.
if valid_runs > 0:
    param_study_results = param_study.launch()
else:
    exit()

def compare_data_and_model(data, model_responses, indep_var, dep_var,
                           plt_func=plt.plot, fig_label=None):
    if fig_label is not None:
        fig = plt.figure(fig_label)
    else:
        fig = None
    data.plot(indep_var, dep_var, plot_function=plt_func, ms=3, labels="data",
            figure=fig, marker='o', linestyle='-', color="#bdbdbd", show=False)
    model_responses.plot(indep_var, dep_var, plot_function=plt_func,labels="models",
                      figure=fig, linestyle='-', alpha=0.5)

all_tension_data = tension_data_collection
all_tension_data = scale_data_collection(all_tension_data,
                                                  "engineering_stress", 1000)
all_sim_tension_data = param_study_results.simulation_history[tension_model.name]
compare_data_and_model(all_tension_data,
                       all_sim_tension_data,
                       "engineering_strain", "engineering_stress")

all_top_hat_sim_data =param_study_results.simulation_history[top_hat_model.name]
compare_data_and_model(top_hat_data_collection,
                       all_top_hat_sim_data,
                       "displacement", "load")
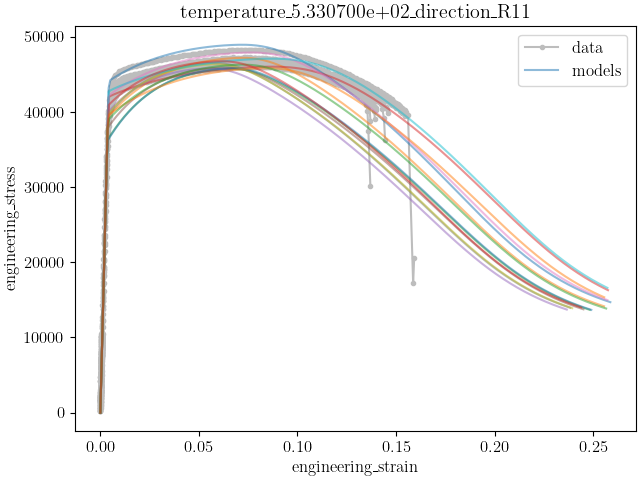
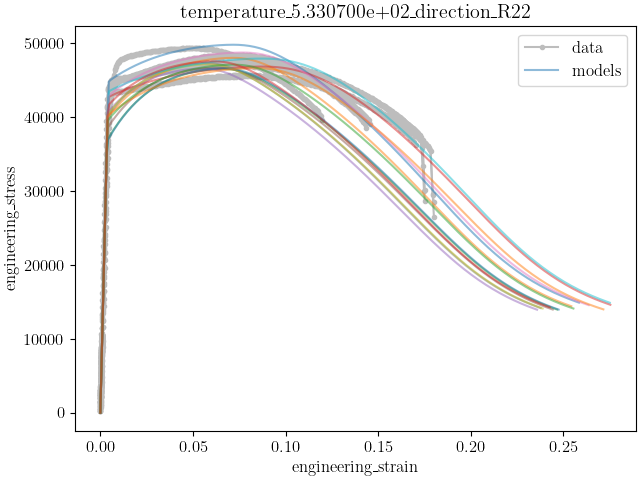
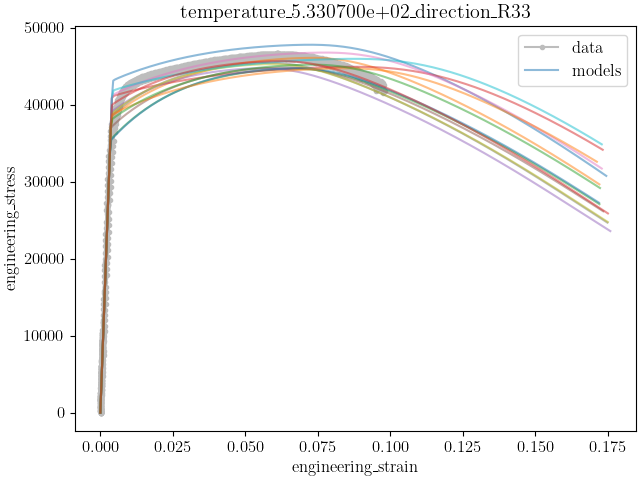
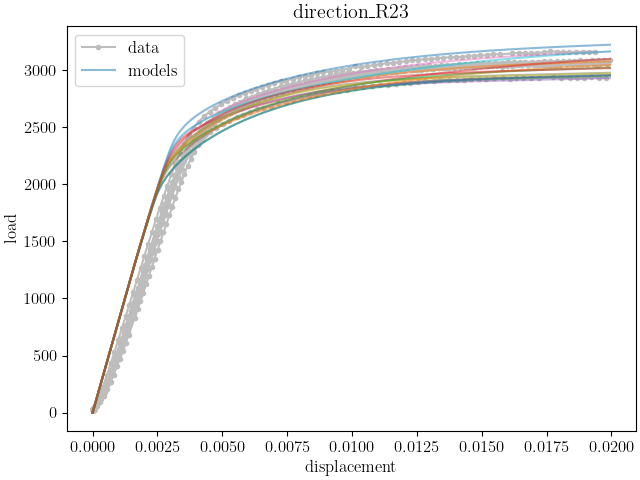
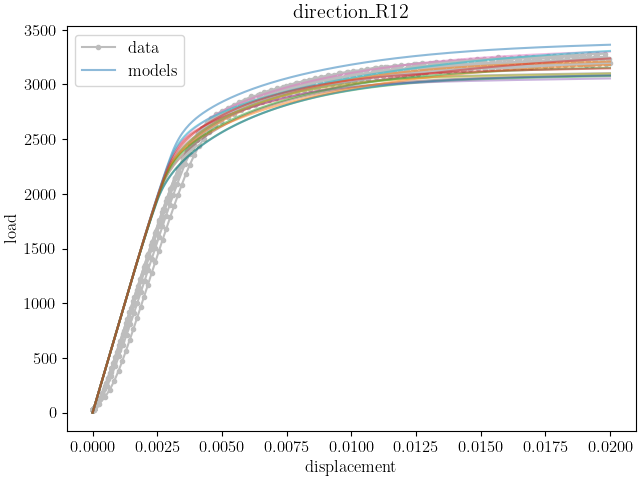
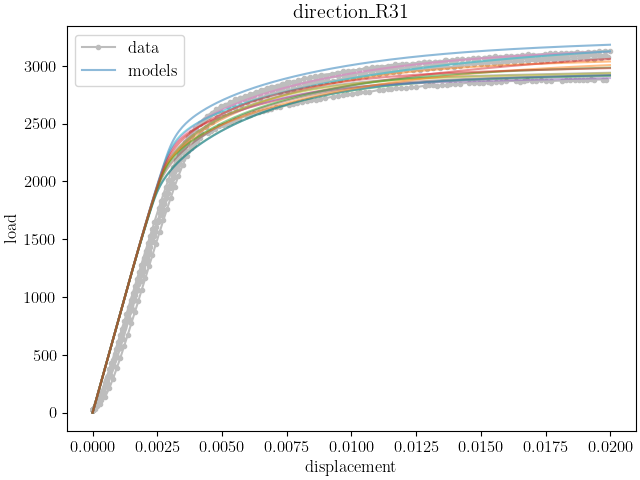
In the plots, the simulation results for the simulated samples does not match the variation in the data sets in the areas where the data were used for calibration, and seem to be a poor representation of the uncertainty. Also, many of the parameter samples were rejected due to being out of bounds indicating an unacceptable results. A potential alternative uncertainty quantification option, that is more computationally expensive, is to do data resampling. With data resampling, random data sets for each model are chosen and the models are calibrated to this random selection. This is repeated for many sample selections. After many calibrations are completed, a population of valid parameter sets are obtained and can be used as the uncertain parameter distributions for the parameters.
Total running time of the script: (52 minutes 50.410 seconds)